Project Overview
- Role: Lead UX/UI & Product Designer
- Services: Information Architecture, Data Visualization, RFM Segmentation Dashboards, B2B SaaS Workflow Design
- Industry: B2B SaaS / Marketing Analytics / Business Intelligence Tools
- Tools: Figma, Miro, Data Visualization Frameworks
1. Context & The Challenge
A data intelligence software company developed an enterprise analytics and marketing platform designed to help growth teams, marketers, and data analysts process customer data, evaluate acquisition performance, and segment customer bases.
The Problem:
Raw customer datasets (CSV exports) and complex RFM (Recency, Frequency, Monetary) models were difficult for marketing teams to interpret, leading to delayed action on high-churn or high-potential customer segments.
Key Pain Points Identified:
- Data Abstraction: Complex statistical models (like RFM matrices) were difficult to visualize and translate into actionable marketing strategies.
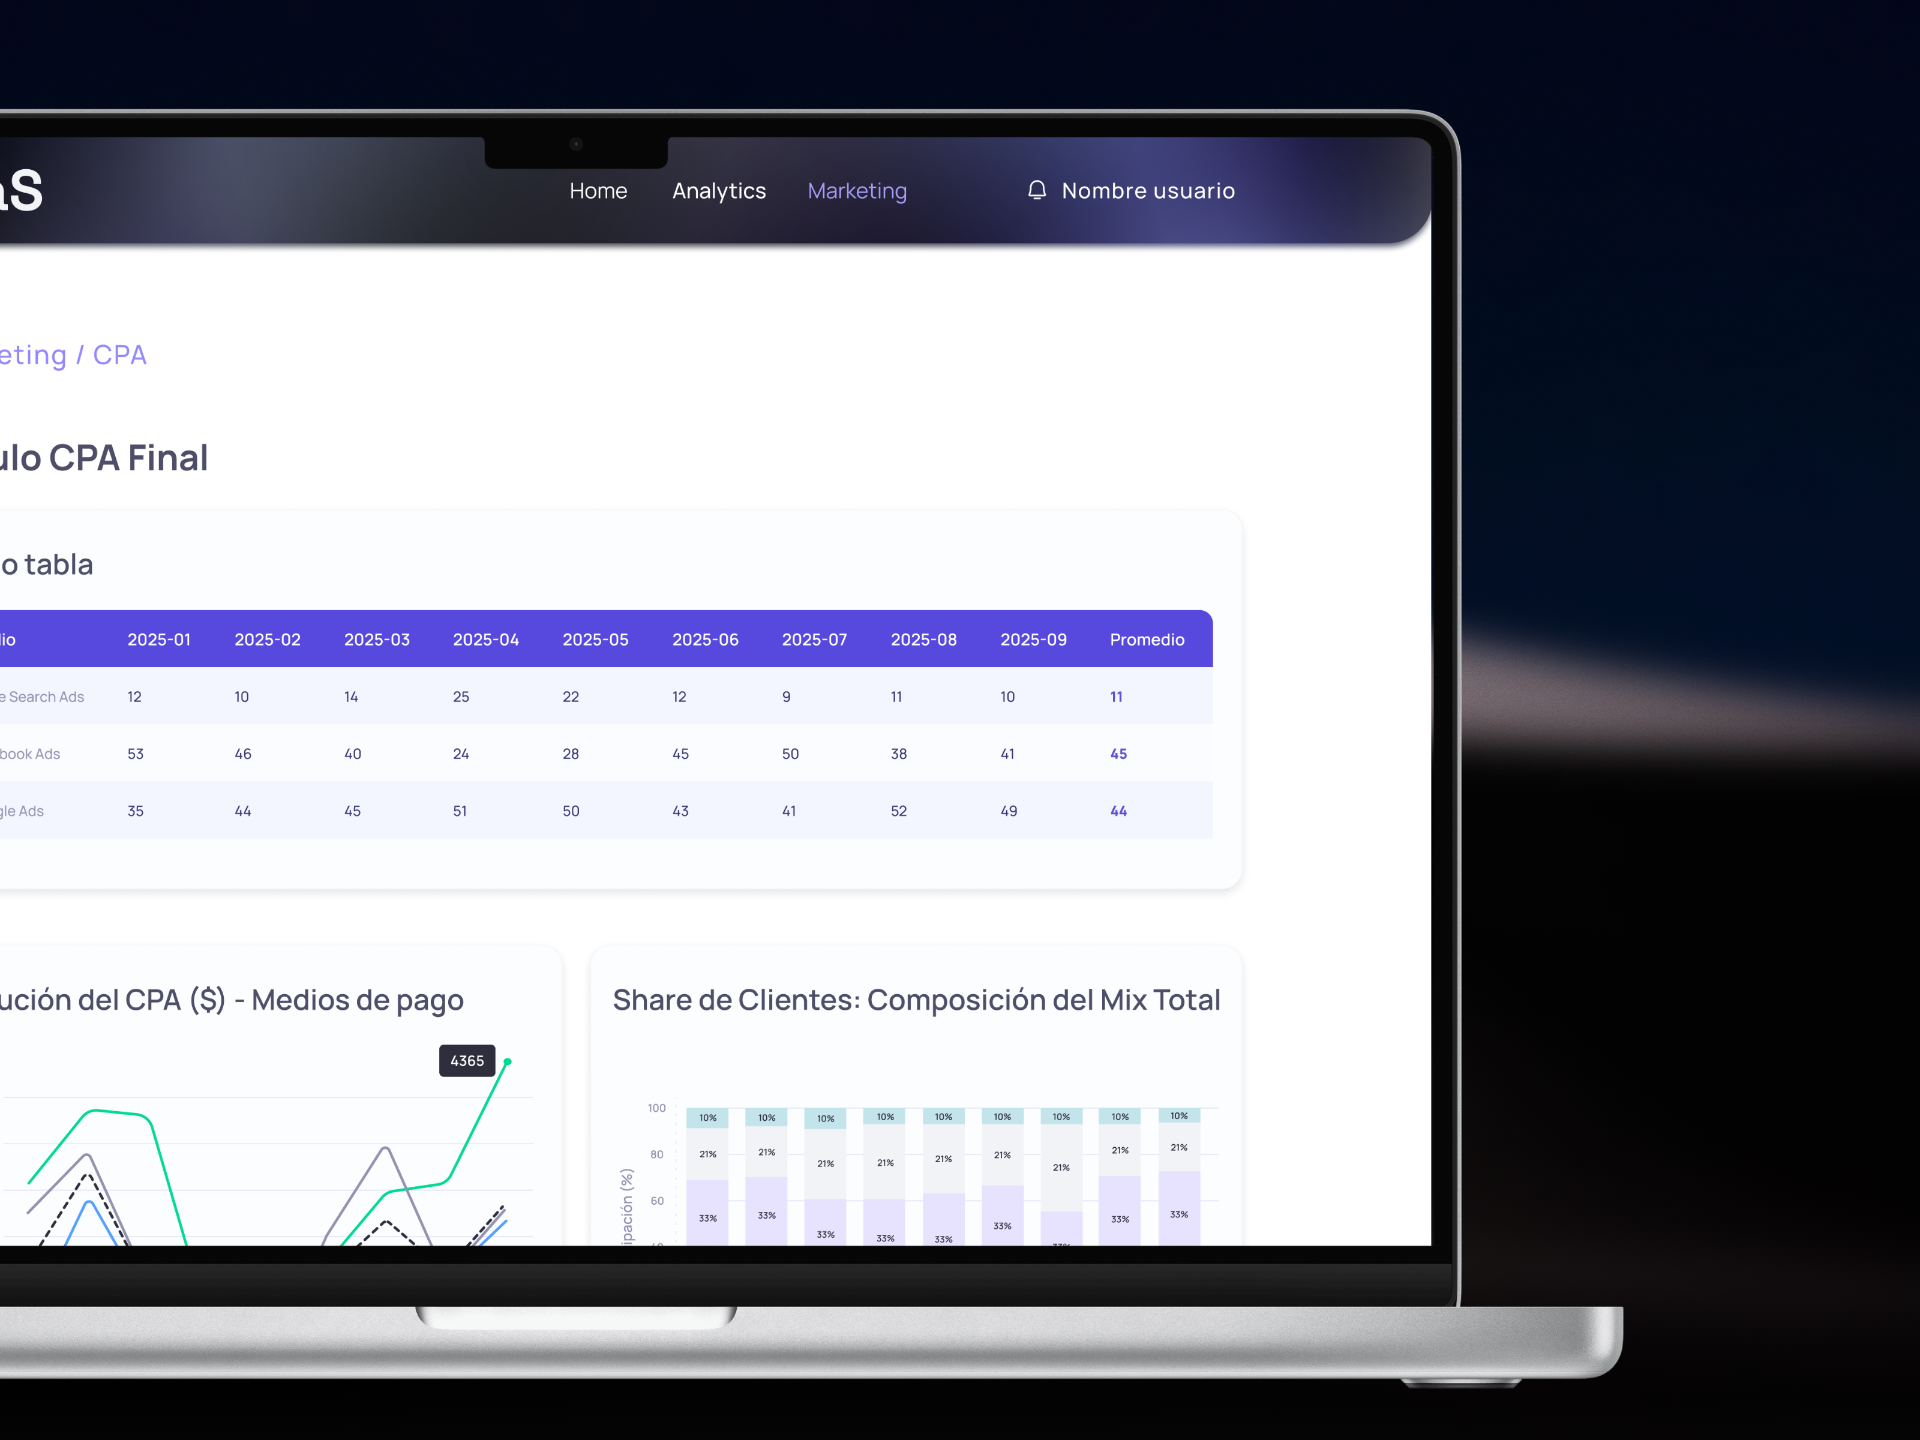
- Fragmented Analytics Workflows: Users had to jump between separate tools to evaluate SEO performance, CPA metrics, and customer retention data.
- Low Actionability: High-density raw data tables lacked clear contextual summaries or direct strategy recommendations.
2. My Approach & Process
I led the UX/UI product architecture to convert heavy data processing into an intuitive, modular workspace for marketing and analytics professionals.
Phase 1: Modular Information Architecture
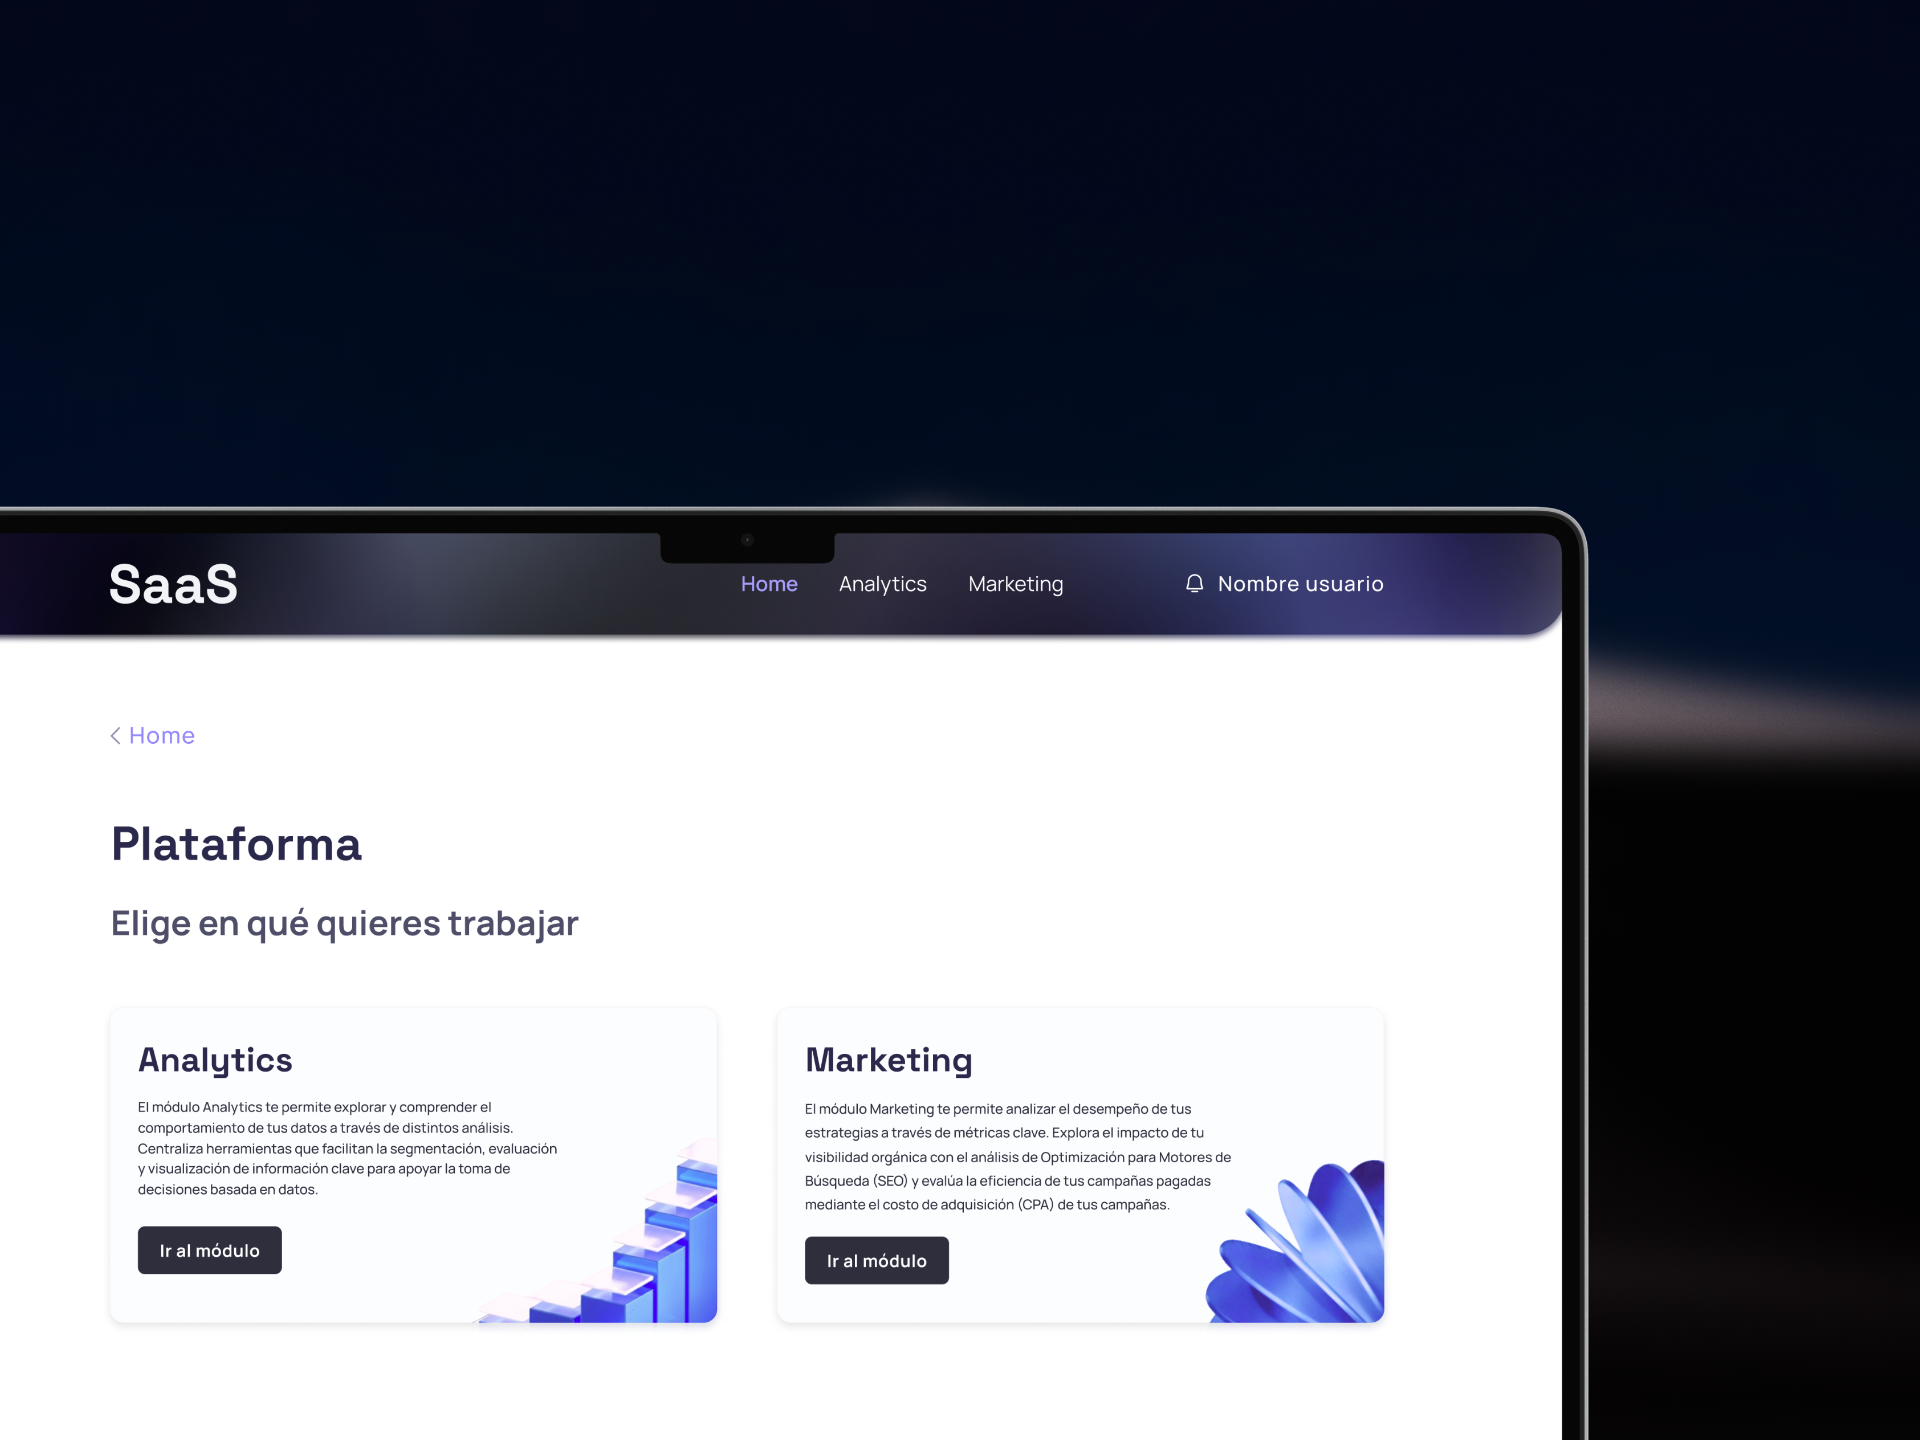
- Structured the navigation around core functional pillars (Analytics / RFM, Metrics, SEO, CPA Marketing) to reduce cognitive load.
- Designed a streamlined CSV file upload and auto-parsing workflow with clear visual feedback for missing or corrupted data entries.
Phase 2: Data Visualization & Matrix Layouts
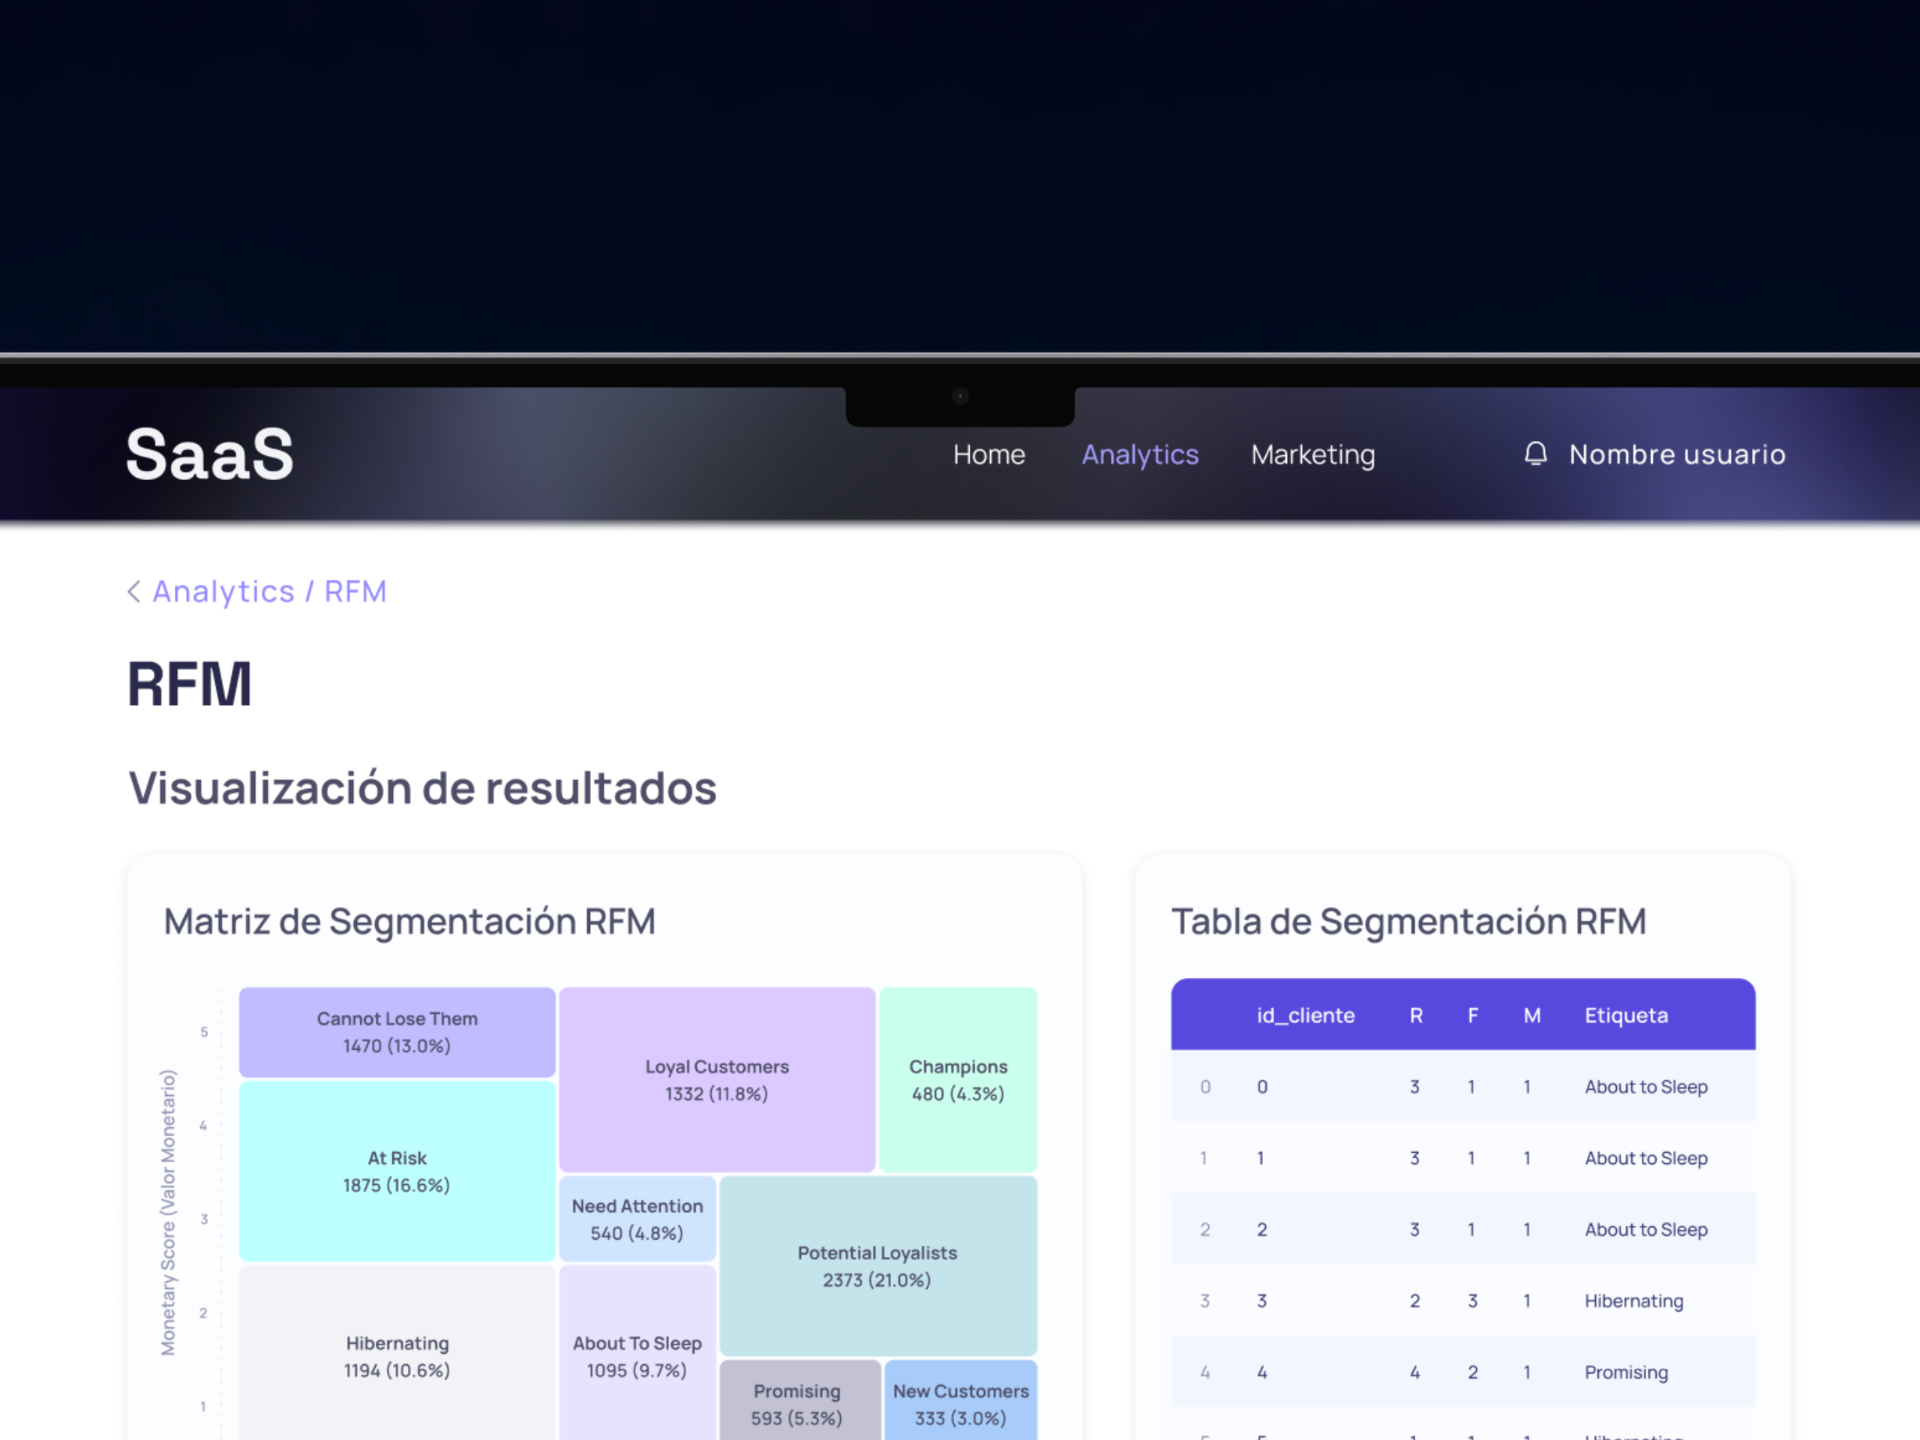
- Re-architected the RFM model into a color-coded 2D matrix paired with interactive segment tables (Champions, At Risk, Potential Loyalists).
- Created collapsible diagnostic summary panels that automatically translate raw numbers into actionable growth strategies.
Phase 3: High-Density UI & Design System
- Built a clean, modern SaaS UI using a high-contrast dark header paired with clean workspace cards and accessible data visualization palettes.
- Standardized table UI controls including column sorting, status tags, CSV exports, and full-screen data views.
3. Key Solutions Implemented
- Interactive RFM Matrix: A visual segmentation map that helps marketers instantly identify customer value tiers and retention risks.
- Automated Data Processing Workspace: Frictionless CSV upload hub that parses and displays processed data tables in seconds.
- Actionable Growth Diagnostics: Contextual strategy panels linking data segments directly to actionable win-back and cross-selling campaigns.
4. Impact & Results
- Faster Data Interpretation: Visual matrix and automated summaries drastically reduced time-to-insight for marketing managers.
- Improved B2B Workflow: Consolidated multi-channel analytics (SEO, CPA, RFM) into a single unified platform.
- Scalable Data Architecture: Delivered a modular UI component library ready for adding new data science modules seamlessly.